Chapter 0 · Prologue
Every Token Has a Supply Chain
Token prices are collapsing, yet AI bills keep rising. Chapter 0 maps the Seven-Layer Tokenomics Stack: price is set at the bottom, volume at the top.
Sanket Kulkarni · · 5 min read
Part of The Seven-Layer Tokenomics Stack
The bill nobody can explain
By May 2026, Google was processing more than 3.2 quadrillion tokens every month. A year earlier, the figure was about 480 trillion. That is a 7x jump in twelve months.
A token is the unit AI works in: a small chunk of text, roughly three-quarters of an English word. You pay for tokens going in and tokens coming out, and many of them you never see. Going in is not just your question: it includes the instructions, documents and earlier conversation the AI re-reads every time it replies. Coming out is not just the answer: many models also "think" before they respond, and that hidden working is counted in tokens too. Every token is manufactured, and every token has a cost.
Here is the puzzle. The price of a token keeps collapsing. Epoch AI found that the cost of reaching a given level of AI performance fell between 9x and 900x a year, depending on the task. Yet ask any chief financial officer (CFO) which way the AI bill is moving, and the answer is the same: up.
Satya Nadella named it in January 2025: "Jevons paradox strikes again!" When something gets cheaper, we use far more of it. Jevons saw it with coal in 1865. We are seeing it with tokens in 2026.
I have spent more than 20 years across commercial operations, pricing and deal-making. On every profit and loss statement (P&L) I have worked on, the biggest lines break down into the same two numbers: price and volume. AI is no different. Most organisations are watching only one of them.
Seven layers, one kitchen
The best map I have found for this is the Seven-Layer Tokenomics Stack, published in October 2026 by the Tokenomics Foundation, a Linux Foundation project. The Foundation sums up the whole discipline in five words: energy to intelligence to value.
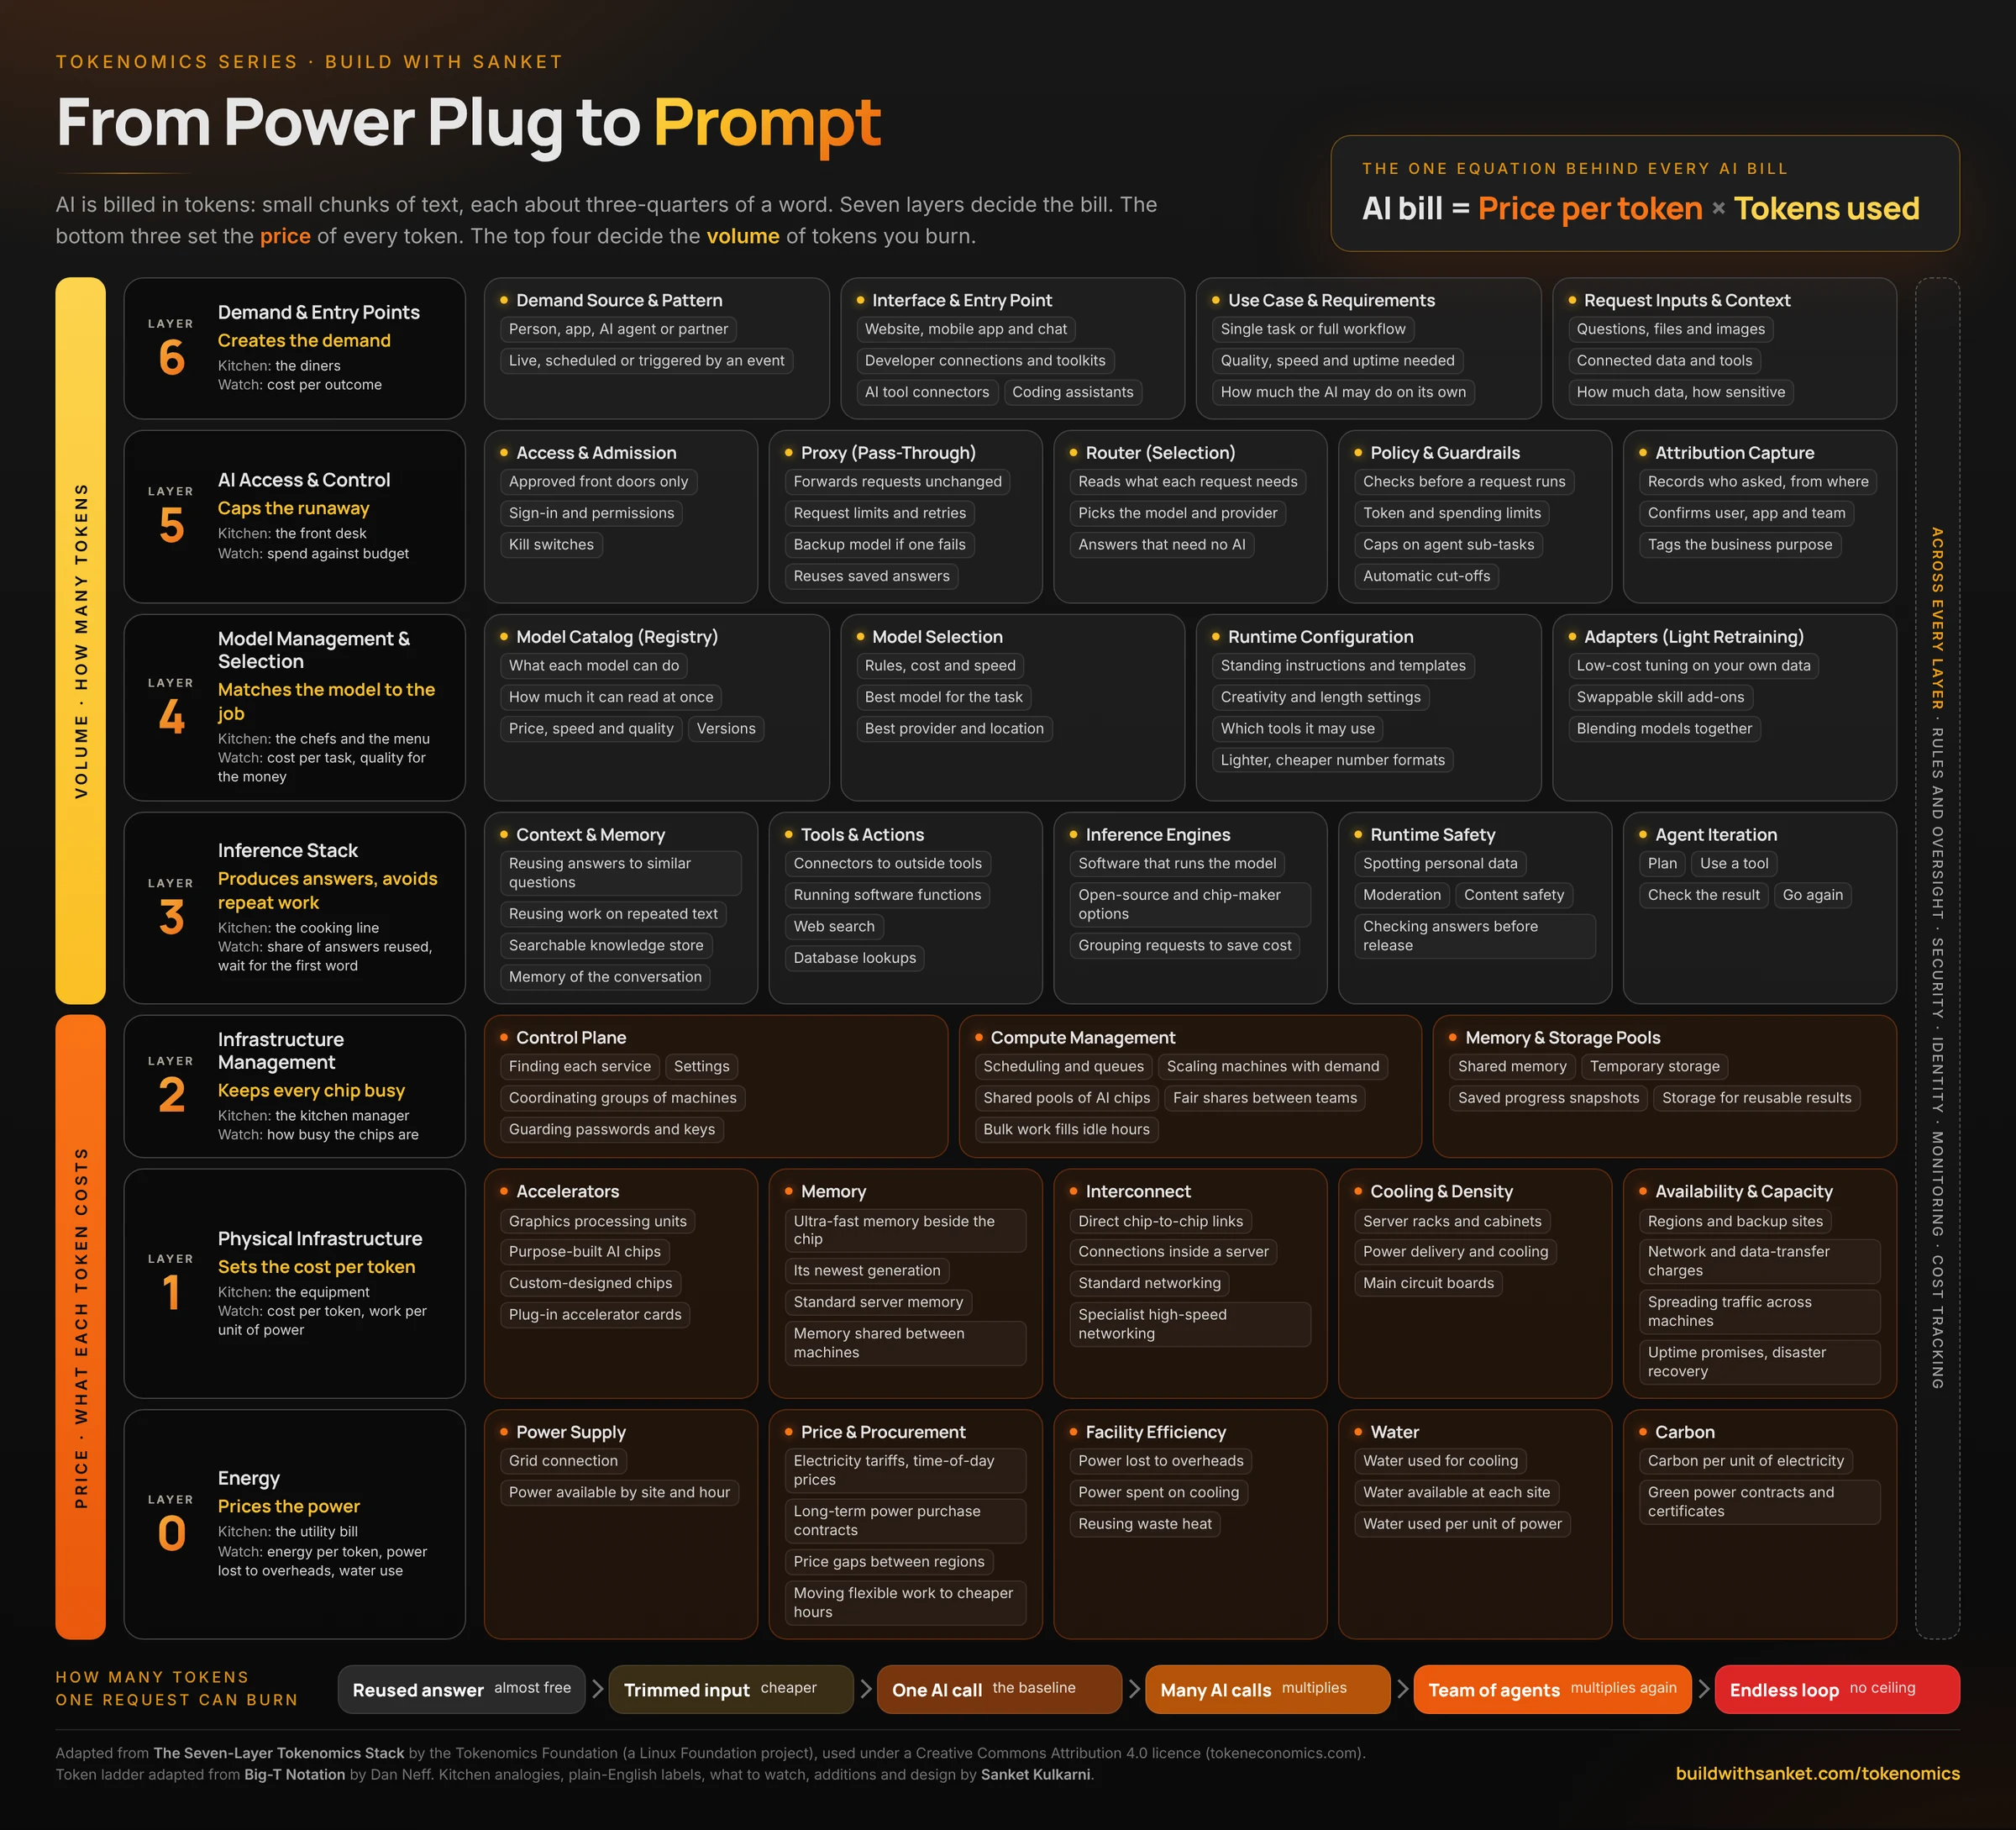
Think of AI as a restaurant kitchen. Read it from the ground up:
- L0 Energy is the gas, power and water bill. Where the data centre sits, and what it pays for every unit of electricity.
- L1 Physical infrastructure is the kitchen equipment. Chips, memory, cables and cooling.
- L2 Infrastructure management is the kitchen manager, keeping every expensive chip busy. An idle stove still pays rent.
- L3 Inference stack is the cooking line, where answers are actually produced. Its best trick is prep work. Every Indian restaurant knows it: make the base gravy once, serve it a hundred ways.
- L4 Model management and selection is the menu and the roster of chefs. Which model cooks which dish. You do not send your head chef to make toast.
- L5 AI access and control is the front desk. Who gets a table, which kitchen takes the order, how much each table can spend, and the power to close the doors.
- L6 Demand and entry points is the diners. Who is asking, through which door, for what, and how much they bring to the table.
Each layer inherits the cost of everything beneath it. Waste at the bottom gets baked into the price of every token above it.
Price is set at the bottom. Volume is set at the top.
If I could put one line from this framework on every boardroom wall, it would be this: what a token costs is decided in the lower layers, and how many tokens get spent is decided in the upper ones.
The bottom three layers (energy, hardware, and how well that hardware is used) set your price per token. The top four (the cooking line, the chef, the front desk and the diners) set your volume. Volume is where the surprises live.
A companion paper from the Foundation, Big-T Notation by Dan Neff of Adobe, shows how wide that range is. The same question can cost almost nothing if a stored answer is reused. It can cost one model call. Or it can quietly fan out into many calls across a team of AI agents. One "extended thinking" request can burn over a hundred thousand tokens while showing you only a few hundred. And an agent stuck in a loop with no stop condition has no ceiling at all. As the framework puts it: "a workload with no ceiling has no worst case."
This is why cheaper tokens can still mean bigger bills. You can win on price at the bottom of the stack and lose it all on volume at the top.
What I would do on Monday morning
This is not theory. In the Foundation's September 2026 survey of 472 organisations, 43% named proving value or return on investment (ROI) as their top challenge. The spend is real. The line from spend to value is not yet drawn.
Three moves, starting now:
- Change the question. Stop asking "what does a token cost us?" Start asking "what does an outcome cost us?" Cost per ticket resolved, per contract reviewed, per customer served.
- Know which layers you actually control. If you only use a model through a provider's application programming interface (API), your levers sit at the top: which model, how you route, what you reuse, what you allow. The more of your own infrastructure you run, the more of the seven become yours.
- Put a ceiling on everything. Budgets, caps on how far agents can fan out, and a kill switch. Before you scale, not after.
The road ahead
In the chapters ahead, I will take this stack apart one component at a time, from the power plug to the prompt.
We start where every token starts: electricity. Data centres used about 415 terawatt-hours (TWh) of electricity in 2024, roughly 1.5% of the world's total. The International Energy Agency (IEA) projects 945 terawatt-hours (TWh) by 2030, more than double. Before AI is software, it is a power problem.
This series builds on The Seven-Layer Tokenomics Stack by the Tokenomics Foundation, used under CC BY 4.0. The restaurant analogy and commentary are mine, and so are any mistakes. Views are my own and do not represent my employer.
Sources
Every figure was checked against its source on 3 November 2026.
- Tokenomics Foundation, The Seven-Layer Tokenomics Stack, 14 October 2026. Layer definitions; what a token costs is decided in the lower layers.
- Tokenomics Foundation, The Seven-Layer Tokenomics Stack (full paper), October 2026. Lower three layers set cost, upper four move consumption; "a workload with no ceiling has no worst case". Credits Ambud Sharma (Pinterest) and Tara Urso (Kion).
- Tokenomics Foundation, What Is AI Tokenomics?, Draft Definition v0.5.2, 1 September 2026. "Energy to Intelligence to Value".
- Dan Neff (Adobe), Big-T Notation, Tokenomics Foundation, 1 August 2026. Extended thinking burning over a hundred thousand tokens per request.
- Tokenomics Foundation, State of Tokenomics: September 2026, 23 September 2026. 472 responses; 43% name proving value or return on investment (ROI) as the top challenge.
- Linux Foundation, Linux Foundation Launches the Tokenomics Foundation, 4 August 2026.
- Sundar Pichai, I/O 2026: Welcome to the agentic Gemini era, Google, 19 May 2026. Over 3.2 quadrillion tokens a month, up from roughly 480 trillion a year earlier.
- Epoch AI, LLM inference prices have fallen rapidly but unequally across tasks, 12 March 2025. Declines of 9x to 900x per year by performance milestone.
- OpenAI Help Center, What are tokens and how to count them? One token is about three-quarters of an English word.
- GeekWire, Microsoft CEO says AI use will skyrocket with more efficiency, January 2025. Nadella's "Jevons paradox strikes again!" post.
- NPR Planet Money, Why the AI world is suddenly obsessed with a 160-year-old economics paradox, 4 February 2025. Jevons and The Coal Question (1865).
- Scientific American, Data Centers Will Use Twice as Much Energy by 2030, Driven by AI, 10 April 2025, reporting the International Energy Agency (IEA) Energy and AI report. 415 terawatt-hours (TWh) in 2024 (about 1.5% of global electricity); 945 terawatt-hours (TWh) projected for 2030.